Madison citizens paying (and reading) their water bills likely noticed not insignificant price increases, along with the change from semi-annual billing to monthly invoices….
I thought it time to see how much our rates have increased and compare that information to per capita income and property tax growth.
I emailed water@cityofmadison.com:
Hi:
I hope that you are well.
I am writing to request historical information on Madison water/sewer bills (annual median and average residential costs), operating budgets and the debt supported by those payments from 1995 to 2015.
Thanks much and best wishes,
Jim
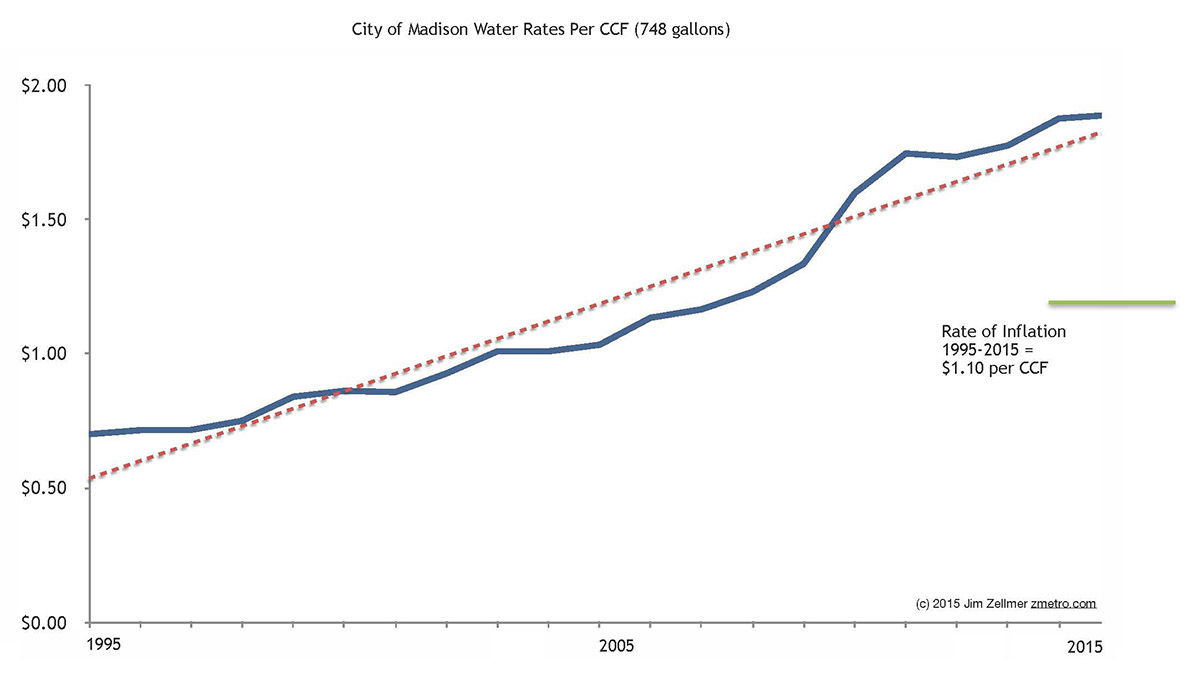
Michael Dailey and others kindly provided data, displayed in the chart below.


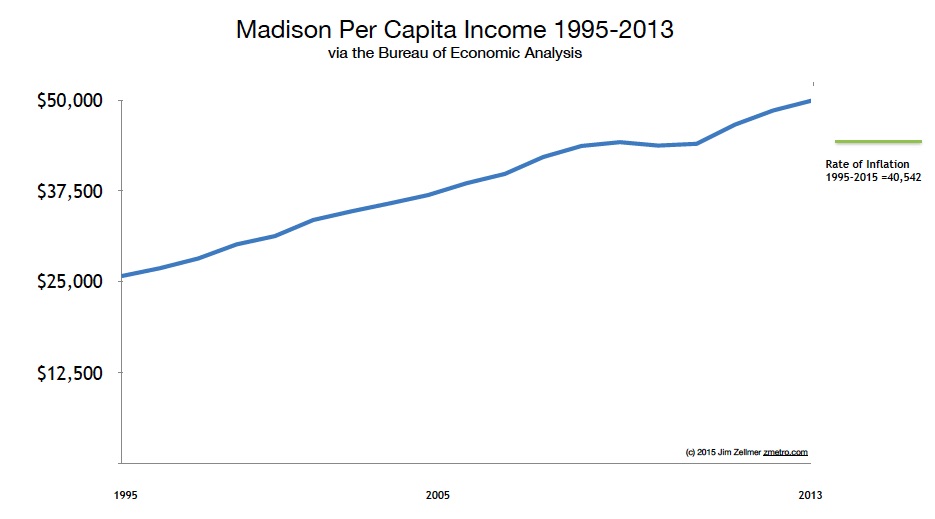
Per capita income data via the Bureau of Economic Analysis.
Historic inflation rates.
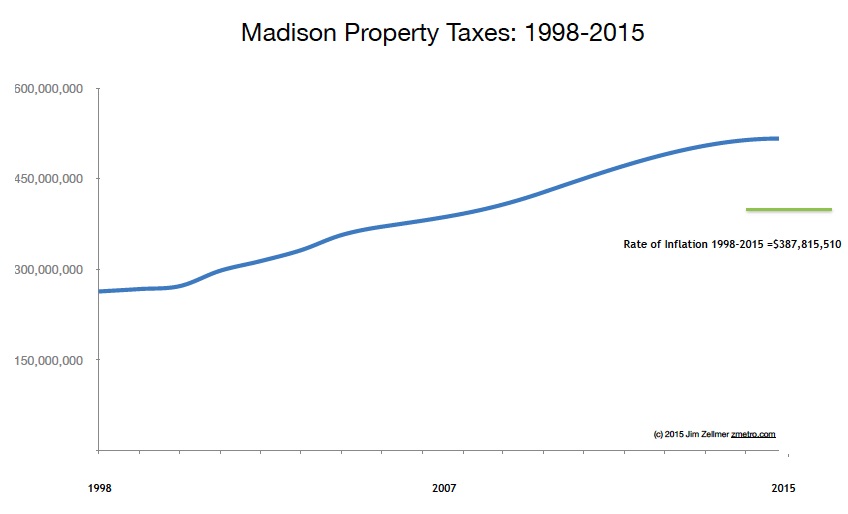
City of Madison budget information.
Extra Credit 1.
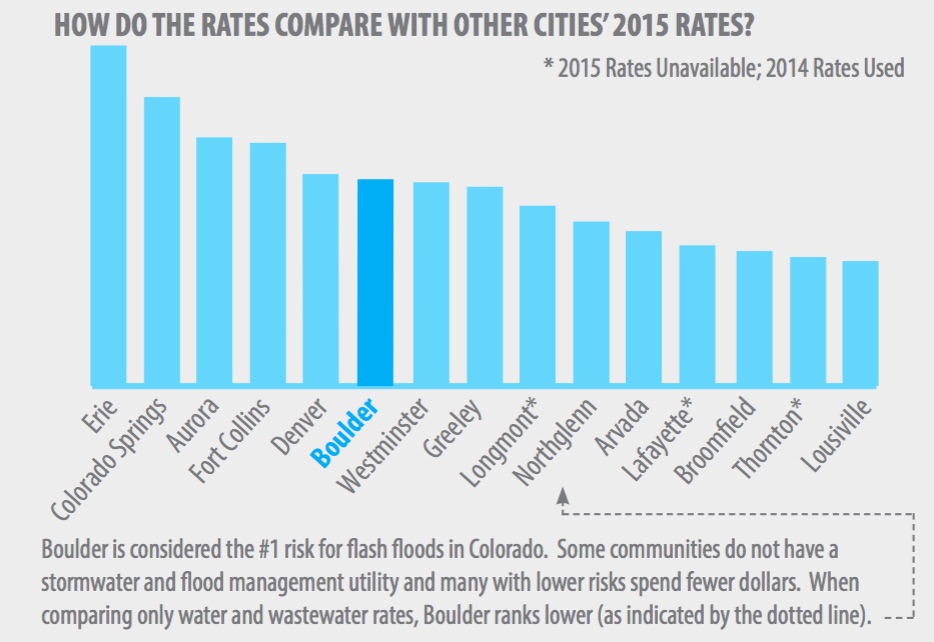
While compiling data, I wondered how water rates might vary across the “sprout belt”, that is, Ann Arbor to Madison to Boulder. Ann Arbor’s water rates were not easily found…
Boulder’s 2015 “utility rate increase PDF” features a “Bezos chart”.

Extra Credit 2:
Mr. Dailey also provided borrowing information:
There have not been very many so it is easiest to just list them out…
2003 $3,505,710
2006 $8,725,000
2008 $11,195,000
2010 $13,135,000
2012 $9,500,000
2014 $9,645,000This is borrowing for the Sewer Utility for the given year. We typically borrow every other year now. Payback is typically 15 year.